General features of the GraphSet NOC Display
In a Network Operation Center, operators need to have 24/7 attention to every Network Element behavior in terms of quantity and characteristics of the network traffic flow. The need to have a wide and quick view of your Network elements and traffic it is a requirement for both small monitoring systems, such a company network, and for big telecommunications companies whose networks cover entire regions in a country or even areas in more than one country. But, how do you achieve it? How can you monitor the traffic flow in your big network, traveling regions, even countries and at the same time be able to check in detail the performance of your networks elements that are spread throughout your network?
The NOC Display it’s your answer. The NOC Display is an integration mechanism for both TRAFip and SLAview tools. It allows you to simultaneously see graphics generated by both tools, providing you a fully customizable overview over the network places and Network Elements of your choice.
With NOC Display you can customize a screen to display a set of graphics of your choice. Thus you can check all the important data at once, ensuring you’ll never miss any relevant detail due to screen transition.
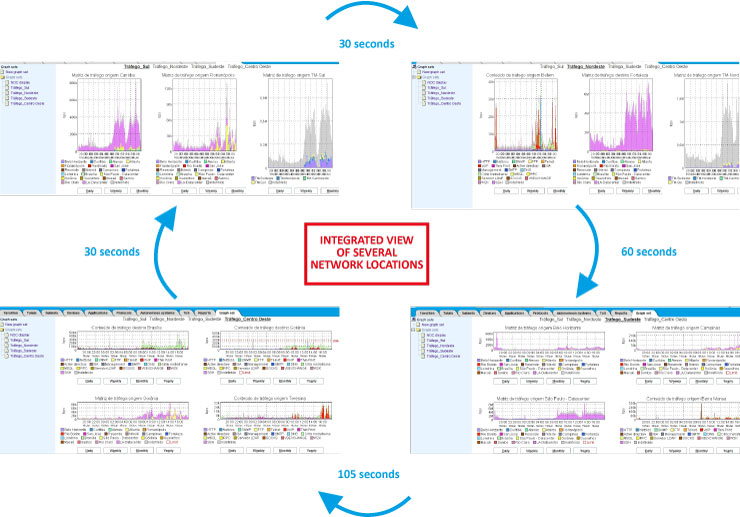
Simultaneous traffic monitoring of different network locations
TRAFip offers a complete visualization of your network traffic flow. It allows you to identify each package and assign it to specific users, applications, servers, workstations, protocols among other possible criteria. The information provided by TRAFip, allows the Operator to correctly diagnose all possible problems affecting the network as well as understand the network usage patterns.
Can you imagine having the best of two worlds? Using TRAFip with NOC Display gives you the possibility to have the best features of TRAFip in a single display, avoiding the need to check your network locations one by one.
Save time and improve your network management efficiency!
NOC Display can also be configured to display several GraphSets in an automatic loop, allowing you to set the time between GraphSets transitions. The sum of these times will result in the period of your loop.
Every time a transition happens, the information in the displayed GraphSet is updated to the latest collected data. Thus the Operator has access to the real time information of the Network Elements or networks places that are shown in that GraphSet.
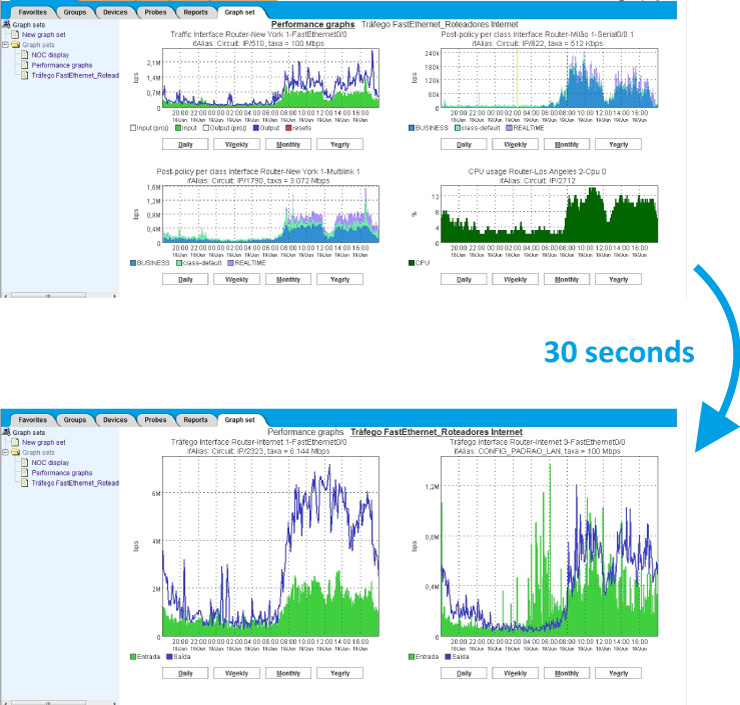
Simultaneous performance analysis between devices
SLAview is a tool that probes precise performance information on IP networks. This is possible through the monitoring of several important network parameters, such as, latency, packet loss, availability, routing errors, traffic in interfaces, CPU usage, to name a few.
With such tool the Operator is able to monitor several types of Network Elements, such as, routers, switches, servers and other SNMP able devices that can be mapped in the network through the SNMP protocol (v1, v2 or v3). The monitored parameters by SLAview can be used as entry data for SLA (Service Level Agreement) indicators, which evaluate the network performance, providing the Operator with the needed information to assure if the Network Elements are working accordingly to the service agreement.
With the NOC Display, you can monitor the main parameters of several Network Elements simultaneously and in real time. This results in a much more accurate analysis on the performance of key elements of the Hardware, such as, Interfaces, CPUs and Memory in your key Network Elements. Nowadays with highly populated networks, filtering the correct information is fundamental for an efficient monitoring. The NOC Display is the right tool to concatenate all needed information in a permanent view.
Have the indicators that really matter, in your network, always available and you will have a much more efficient monitoring!
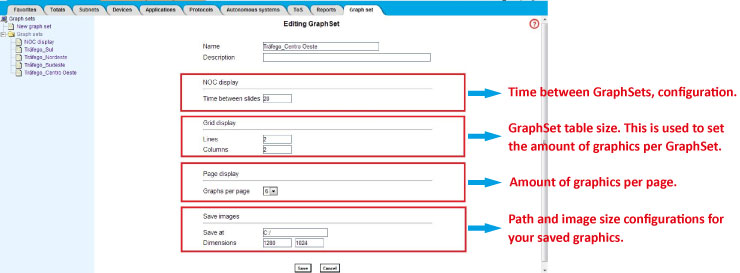
Flexibility in the GraphSets configuration
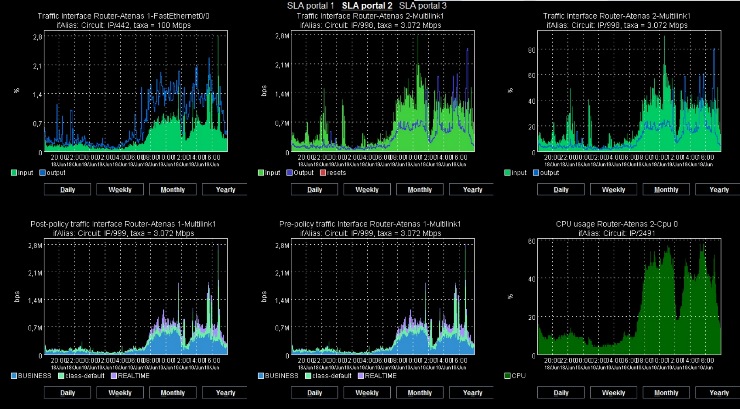
With a totally flexible configuration, the NOC Display allows you to determine which graphs you want to see in each GraphSet and the transition time between the GraphSet slides. Furthermore, as a cost saving measure to Network Operation Centers, it allows you to change the background color to black, as seen in Picture 1, contributing to increase the lifetime of projector lights.
 +55 (21) 3211-2223 info@telcomanager.com