Multi-variable Reports
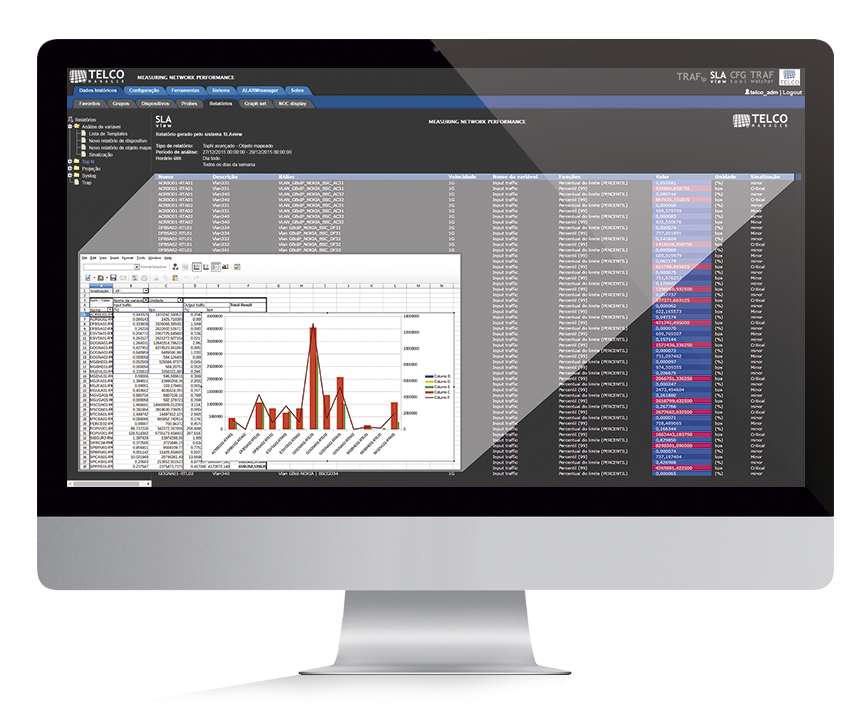
Select variables, statistics, filters, data signalling and have all the important data in one report. You can also export this data to be manipulated by your favourite spreadsheet application.

performance
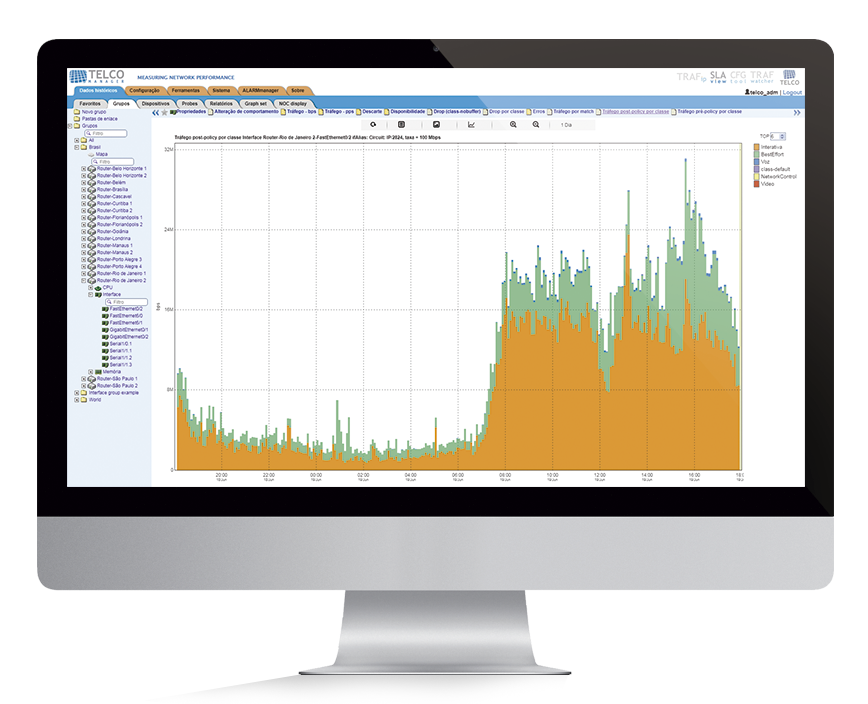
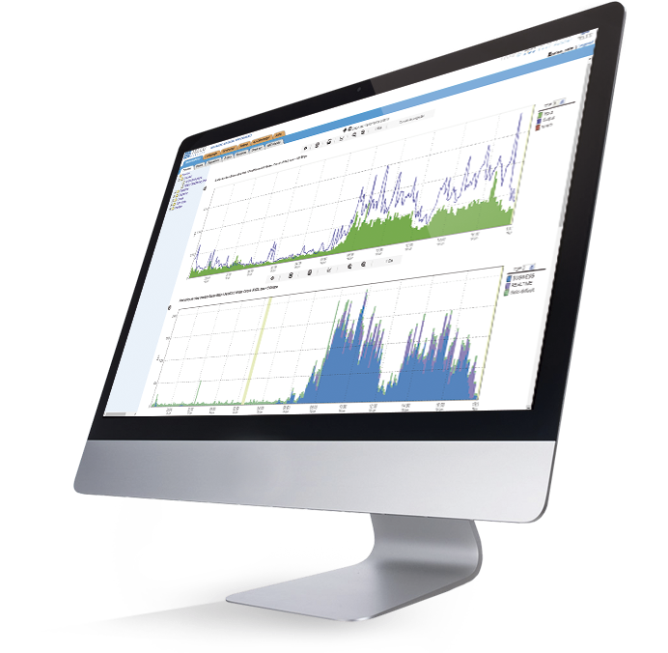
With easy-to-understand graphics, monitor the multiple performance variables available on your devices. Get the visibility you need to take complete control of your network.

fully integrated
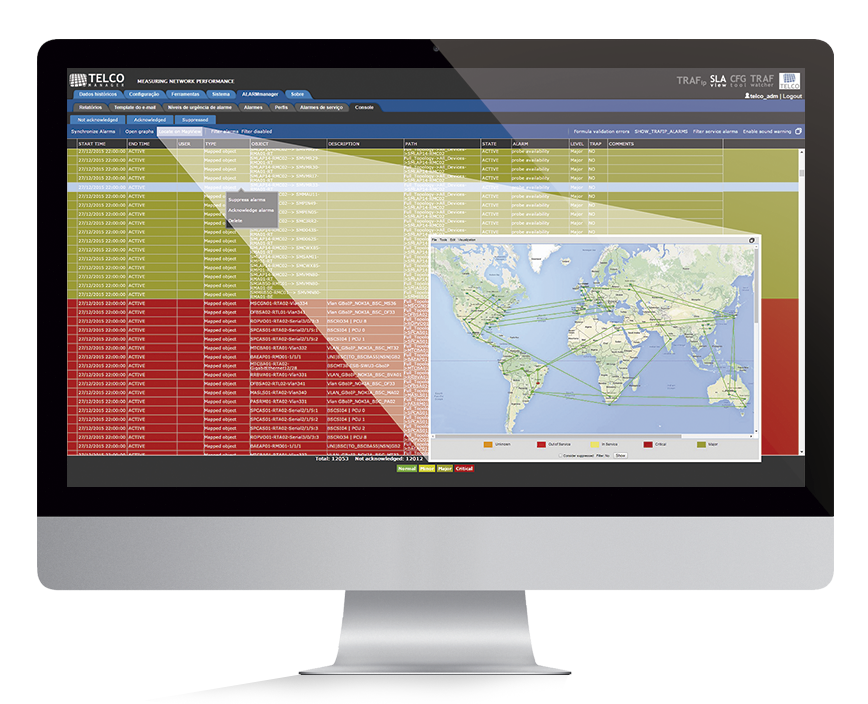
Alarms from the ALARMmanager console are reflected on hierarchical maps, allowing you to group, drill down and easily identify the root cause of alarm storms.
Freely create the KPIs(Key performance indicators) that make sense for your business. Using the SLAview profiles you can monitor anything that is exported through the SNMP protocol or by custom scripts from our scripts collection or by writing your own.
Turn on the behaviour change alarm on any KPI that you created to monitor behaviour changes for that KPI. This feature is great to monitor sudden and unexpected traffic changes on your network.
Don’t wast your time doing the same thing twice. SLAview puts the profile and templated conception to really work. Create a profile or templates and use it multiple times to speed up configuration.
We hate to waste time, and probably you too, after you create your profile and are happy with them, build up simple rules to say to SLAview which profile to use for each device family and never do it again in your life. Ruled can be based in any device characteristics.
Using Lua, a very simple and powerful script language, you can create custom data collection methods. Put your hands on any available data within your network, whatever its available through SNMP, Telnet, SSH, HTTP, or any other scriptable protocol.
 +55 (21) 3211-2223 info@telcomanager.com

