We all know how important (and boring) it is the elaboration of periodic detail reports in a corporate environment. The network administrator is constantly put in a situation where it needs to justify any change or acquisition of new devices and technologies. Other cases, simply want to check which are the N applications which consume more your bandwidth. With the use of Telcomanager’s reporting tools, these tasks become simpler and automatic!
It is possible to generate fully customizable reports showing various information like source IP address, destination IP , source port, destination port, among others. In addition, the administrator can generate the report immediately or schedule it for future executions. The beauty of the tool is that once the configuration is made repetitive reports run automatically.
Reports of raw data
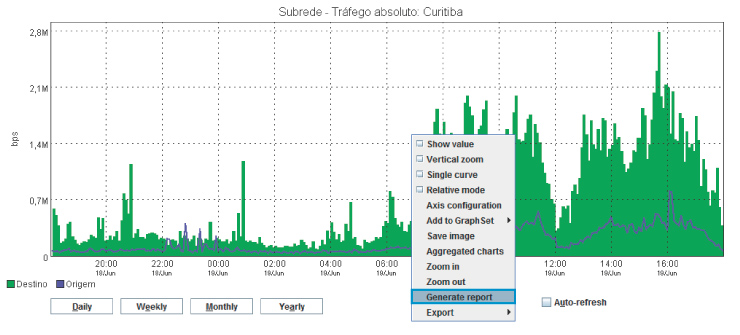
A raw data report simply shows all traffic flows occurred in the network which follow a certain user-defined pattern. For example, a fast and practical way to generate such report in TRAFip is through a graph that shows the detail information the administrator would like to have. If the user right-click on any part of a graph it will pop-up the interactive menu as shown in Figure 1. This interactive menu has an option called “Generate Report”, which will open a new window. Note that the position of the mouse will record the time/date to be passed to the following windows, therefore if it’s required a report at 9am, the mouse has to be over this time of the graph.

In this window, it can be defined if the report will be generated immediately or periodically scheduled for the future. The output format can be chosen (HTML, Java, CSV, TSV, PDF and SP GURU), as well as the maximum number of rows displayed. Additional configuration can be done on the scheduled reporting by accessing the following path: System -> Settings -> Reports -> Scheduled Reports.
It’s possible to choose to display or not the IP’s interface, initial period for report generation, object type (example: application, AS, Group AS, device, domain, etc.) and the object itself.
For example, if the administrator wants to generate a report with the traffic information of a given subnet in your network, this object must be selected in ‘Object Type’ and a list of all subnets registered in the system will be available in ‘Object’.
In the case of a report that includes two hours of traffic, simply set this value to the field ‘Interval’. Reports can be generated up to 6 hours. For longer intervals simply change of default parameters at: System -> Settings -> Reports -> Scheduled Reports. The report options can also be configured to show the flow direction (input, output or both) and whether the row sorting will be done by bytes, packets or flows.
Another important report parameter is to filter the objects on the selected profile. With this it can show the undefined traffic on the network, which is very important for troubleshooting. Also, if NetFlow is configured with sampling, the configuration can set statically the sampling rate or detected automatically through the flow records exported.
One useful feature is to consolidate flows in a period, thus easily visualize traffic occurred in a given time window.
In addition to all these features, is possible to determine which data keys are displayed in the report, example: source IP address, destination IP address, source port, Layer 3 protocol, etc. Moreover, a filter can be added, for instance, to report only traffic that originates from a particular IP address. Logical operation (ADD/OR) can be added if multiple filters are being used.
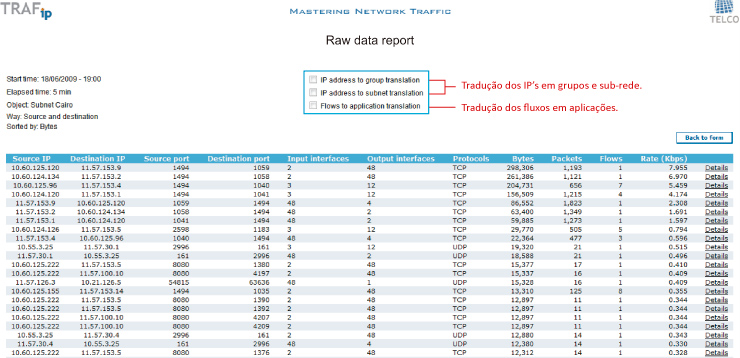
As demonstrated above, the range of possibilities is large. With few settings and configuration, the tool is able to report exactly what the network administrator is expecting. An example of a HTML report generated by TRAFip is shown in Figure 2.

On the screen with the report generated is still possible to make the translation of IP’s per group and subnet and flows per application. Clicking on ‘Details’ each flow that originated the corresponding traffic is shown.
Top N Reports
The Top N report can be generated for each type of objects, interfaces, subnets, devices, applications, etc. It can be created accessing the following tree: “Historical data -> Reports -> Top N”.
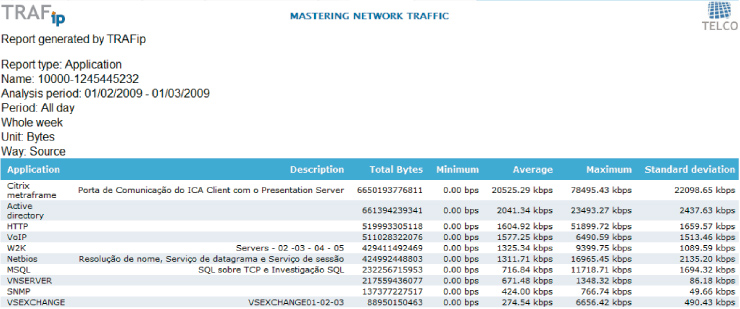
The Top N reporting feature also include the option to generate immediately or scheduled a report. The object type can be selected from the menu or simply click the icon corresponding to the chosen object on the left side of the screen. A filter with a name or time window can be chosen (weekends may or may not be considered). Additional information like Flow direction, the unit used, the output format and percentile can also be defined. An example report Top N application can be seen in Figure 3.

Scheduling reports and templates
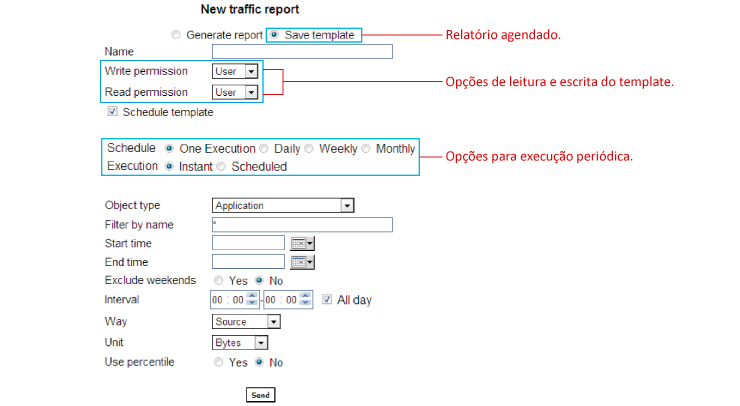
TRAFip allows to schedule traffic reports. Simply save a report template and indicate the time of delivery and periodicity. The configuration to create a report template can be seen in Figure 4.

Conclusion
The reports generated by Telcomanager tools are really handy for any network administrator who requires to constantly justify investment in network resources and don’t have much time to spend on creating detail reports. The possibility of scheduling reports using templates avoids the need for repetitive activity, saving time and avoiding human errors.
Do not let any detail go unnoticed! Dig into your network through the reports generated by Telcomanager’s tools now!
 +55 (21) 3211-2223 info@telcomanager.com